In my post on How To Write Nagios Plugin – Bash Script we learned how to write a Nagios Plugin Bash Script with correct responses and exit codes for Nagios Server to understand. The next step is to enable Pnp4Nagios graphs for our custom Nagios Plugin Bash Script to get the performance data. To get performance data for the desired Nagios check we must provide Nagios Server and Pnp4Nagios with the correct response syntax which we will explain in this post. If not, you will probably get “”Pnp4Nagios XML file not found. Read FAQ online” error.
Let’s fix Pnp4Nagios XML file not found Error!
Prerequisites:
- Working Nagios Server Instance (Read about Nagios Server on Ubuntu or CentOS)
- Working Nagios NRPE Client Instance
- Working Pnp4Nagios instance (Read more HERE)
The problem:
Let’s say we have written a custom Nagios Plugin Bash Script and configured Nagios Server combined with Pnp4Nagios to create graphs. When we try to open Pnp4Nagios performance data graphs for custom Nagios Plugin we get “Pnp4Nagios XML file not found. Read FAQ online” error:

The cause:
To get Pnp4Nagios performance data graph every Nagios Plugin Script must put out the correct output which is correctly understood by Pnp4Nagios. You can read more about this HERE and HERE. So the cause for “Pnp4Nagios XML file not found Error” is wrong Nagios Plugin Script output.
In short Nagios Plugin Script output syntax must be as follows::
TEXT_OUTPUT_SEEN_ON_NAGIOS_WEB | label=value[UOM];[warn];[crit];[min];[max]
label = human readable name of the graph label
value = numerical current value of the check output
UOM = unit of measurement
warn = warning threshold of the check
crit = critical threshold of the check
min = minimal possible value of the check
max = maximal possible value of the check
All of the data after the pipe (|) will be hidden in Nagios web GUI. This data is only needed for Pnp4Nagios performance data graphs and is not visible to Nagios web GUI users. However this data will be visible if you will run Nagios Plugin Bash script locally on the Nagios Client or Nagios Server from command line.
The solution for “Pnp4Nagios XML file not found Error”:
If we continue with the working example from my previous post – We need to edit the script check_open_files.sh and add performance data parameters to it’s output. We need to add “| NumOpenFiles=$ofiles;$2;$3;0;
Below is the fixed check_open_files.sh bash script – BOLD TEXT IS ADDED to the original script!
#!/bin/bash
# Nagios Plugin Bash Script - check_open_files.sh
# This script checks the number of currently opened files for the specified user with the specified WARNING and CRITICAL threshold
#
# Check for missing parameters
if [[ -z "$1" ]] || [[ -z "$2" ]] || [[ -z "$3" ]]; then
        echo "Missing parameters! Syntax: ./check_open_files.sh USER WARNING_THRESHOLD CRITICAL_THRESHOLD"
        exit 2
fi
# Check for number of currently opened files
ofiles=$(sudo /usr/sbin/lsof |grep $1 |grep REG |wc -l)
# Check if number of currently opened files is lower than WARNING threshold parameter
if [[ "$ofiles" -lt "$2" ]]; then
        echo "OK - Number of open files is $ofiles | NumOpenFiles=$ofiles;$2;$3;0;10000"
        exit 0
fi
# Check if number of currently opened files is greater than WARNING threshold parameter and lower than CRITICAL threshold parameter
if [[ "$ofiles" -gt "$2" ]] && [[ "$ofiles" -lt "$3" ]]; then
        echo "WARNING - Number of open files is $ofiles | NumOpenFiles=$ofiles;$2;$3;0;10000"
        exit 1
fi
# Check if number of currently opened files is greater than CRITICAL threshold parameter
if [[ "$ofiles" -gt "$3" ]]; then
        echo "CRITICAL - Number of open files is $ofiles | NumOpenFiles=$ofiles;$2;$3;0;10000"
        exit 2
fi
We can now try and run this script locally on the Nagios Client and see the output we will get:
[root@foo1 ~]# /usr/lib64/nagios/plugins/check_open_files.sh apache 1900 2048
OK - Number of open files is 1592 | NumOpenFiles=1592;1900;2048;0;10000
Wooohoo, the output we are getting is correct!!
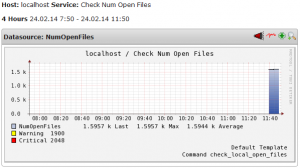
Let’s just make sure we restart Nagios NRPE Client service and wait a couple of minutes before we check the Pnp4Nagios performance data graphs. I checked about 15 minutes later and as we can see the Pnp4Nagios performance data graphs are now working perfectly – no more “Pnp4Nagios XML file not found Error”:
